


How to Debug a Node.js Application: Tips, Tricks and Tools
Software development is complex and, at some point, your Node.js application will fail. If you’re lucky, your code will crash with an obvious error message. If you’re unlucky, your application will carry on regardless but not generate the results you expect. If you’re really unlucky, everything will work fine until the first user discovers a catastrophic disk-wiping bug.
What is Debugging?
Debugging is the black art of fixing software defects. Fixing a bug is often easy — a corrected character or additional line of code solves the problem. Finding that bug is another matter, and developers can spend many unhappy hours trying to locate the source of an issue. Fortunately, Node.js has some great tools to help trace errors.
Terminology
Debugging has its own selection of obscure jargon, including the following:
| Term | Explanation |
|---|---|
| breakpoint | the point at which a debugger stops a program so its state can be inspected |
| debugger | a tool which offers debugging facilities such as running code line by line to inspect internal variable states |
| feature | as in the claim: “it’s not a bug, it’s a feature”. All developers say it at some point during their career |
| frequency | how often or under what conditions a bug will occur |
| it doesn’t work | the most-often made but least useful bug report |
| log point | an instruction to a debugger to show the value of a variable at a point during execution |
| logging | output of runtime information to the console or a file |
| logic error | the program works but doesn’t act as intended |
| priority | where a bug is allocated on a list of planned updates |
| race condition | hard-to-trace bugs dependent the sequence or timing of uncontrollable events |
| refactoring | rewriting code to help readability and maintenance |
| regression | re-emergence of a previously fixed bug perhaps owing to other updates |
| related | a bug which is similar or related to another |
| reproduce | the steps required to cause the error |
| RTFM error | user incompetence disguised as a bug report, typically followed by a response to “Read The Flipping Manual” |
| step into | when running code line by line in a debugger, step into the function being called |
| step out | when running line by line, complete execution of the current function and return to the calling code |
| step over | when running line by line, complete execution of a command without stepping into a function it calls |
| severity | the impact of a bug on system. For example, data loss would normally be considered more problematic than a UI issue unless the frequency of occurrence is very low |
| stack trace | the historical list of all functions called before the error occurred |
| syntax error | typographical errors, such as console.lug() |
| user error | an error caused by a user rather than the application, but may still incur an update depending on that person’s seniority |
| watch | a variable to examine during debugger execution |
| watchpoint | similar to a breakpoint, except the program is stopped when a variable is set to a specific value |
How to Avoid Bugs
Bugs can often be prevented before you test your application …
Use a Good Code Editor
A good code editor will offer numerous features including line numbering, auto-completion, color-coding, bracket matching, formatting, auto-indentation, variable renaming, snippet reuse, object inspection, function navigation, parameter prompts, refactoring, unreachable code detection, suggestions, type checking, and more.
Node.js devs are spoiled for choice with free editors such as VS Code, Atom, and Brackets, as well as plenty of commercial alternatives.
Use a Code Linter
A linter can report code faults such as syntax errors, poor indentation, undeclared variables, and mismatching brackets before you save and test your code. The popular options for JavaScript and Node.js include ESLint, JSLint, and JSHint.
These are often installed as global Node.js modules so you can run checks from the command line:
eslint myfile.js
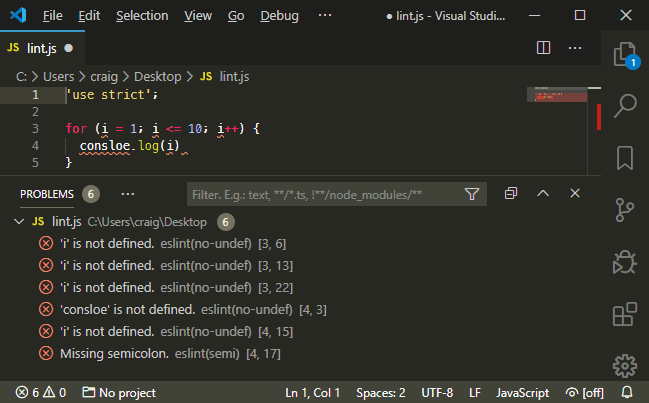
However, most linters have code editor plugins, such as ESLint for VS Code and linter-eslint for Atom which check your code as you type:
Use Source Control
A source control system such as Git can help safe-guard your code and manage revisions. It becomes easier to discover where and when a bug was introduced and who should receive the blame! Online repositories such as GitHub and Bitbucket offer free space and management tools.
Adopt an Issue-tracking System
Does a bug exist if no one knows about it? An issue-tracking system is used to report bugs, find duplicates, document reproduction steps, determine severity, calculate priorities, assign developers, record discussions, and track progress of any fixes.
Online source repositories often offer basic issue tracking, but dedicated solutions may be appropriate for larger teams and projects.
Use Test-driven Development
Test-driven Development (TDD) is a development process which encourages developers to write code which tests the operation of a function before it’s written — for example, is X returned when function Y is passed input Z.
Tests can be run as the code is developed to prove a function works and spot any issues as further changes are made. That said, your tests could have bugs too …
Step Away
It’s tempting to stay up all night in a futile attempt to locate the source of a nasty bug. Don’t. Step away and do something else. Your brain will subconsciously work on the problem and wake you at 4am with a solution. Even if that doesn’t happen, fresh eyes will spot that obvious missing semicolon.
Node.js Debugging: Environment Variables
Environment variables that are set within the host operating system can be used to control Node.js application settings. The most common is NODE_ENV, which is typically set to development when debugging.
Environment variables can be set on Linux/macOS:
NODE_ENV=development
Windows cmd:
set NODE_ENV=development
Or Windows Powershell:
$env:NODE_ENV="development"
Internally, an application will enable further debugging features and messages. For example:
// is NODE_ENV set to "development"?
const DEVMODE = (process.env.NODE_ENV === 'development');

if (DEVMODE) {
  console.log('application started in development mode on port ${PORT}');
}
NODE_DEBUG enables debugging messages using the Node.js util.debuglog (see below), but also consult the documentation of your primary modules and frameworks to discover further options.
Note that environment variables can also be saved to a .env file. For example:
NODE_ENV=development
NODE_LOG=./log/debug.log
SERVER_PORT=3000
DB_HOST=localhost
DB_NAME=mydatabase
Then loaded using the dotenv module:
require('dotenv').config();
Node.js Debugging: Command Line Options
Various command-line options can be passed to the node runtime when launching an application. One of the most useful is --trace-warnings, which outputs stack traces for process warnings (including deprecations).
Any number of options can be set, including:
--enable-source-maps: enable source maps (experimental)--throw-deprecation: throw errors when deprecated features are used--inspect: activate the V8 inspector (see below)
By way of an example, let’s try to log the crypto module’s DEFAULT_ENCODING property, which was deprecated in Node v10:
const crypto = require('crypto');

function bar() {
  console.log(crypto.DEFAULT_ENCODING);
}

function foo(){
  bar();
}

foo();
Now run this with the following:
node index.js
We’ll then see this:
buffer
(node:7405) [DEP0091] DeprecationWarning: crypto.DEFAULT_ENCODING is deprecated.
However, we can also do this:
node --trace-warnings index.js
That produces the following:
buffer
(node:7502) [DEP0091] DeprecationWarning: crypto.DEFAULT_ENCODING is deprecated.
    at bar (/home/Desktop/index.js:4:22)
    at foo (/home/Desktop/index.js:8:3)
    at Object.<anonymous> (/home/Desktop/index.js:11:1)
    at Module._compile (internal/modules/cjs/loader.js:1151:30)
    at Object.Module._extensions..js (internal/modules/cjs/loader.js:1171:10)
    at Module.load (internal/modules/cjs/loader.js:1000:32)
    at Function.Module._load (internal/modules/cjs/loader.js:899:14)
    at Function.executeUserEntryPoint [as runMain] (internal/modules/run_main.js:71:12)
    at internal/main/run_main_module.js:17:47
This tells us that the deprecation warning comes from the code in line 4 (the console.log statement), which was executed when the bar function ran. The bar function was called by the foo function on line 8 and the foo function was called on line 11 of our script.
Note that the same options can also be passed to nodemon.
Console Debugging
One of the easiest ways to debug an application is to output values to the console during execution:
console.log( myVariable );
Few developers delve beyond this humble debugging command, but they’re missing out on many more possibilities, including these:
console method |
description |
|---|---|
.log(msg) |
output a message to the console |
.dir(obj,opt) |
uses util.inspect to pretty-print objects and properties |
.table(obj) |
outputs arrays of objects in tabular format |
.error(msg) |
output an error message |
.count(label) |
a named counter reporting the number of times the line has been executed |
.countReset[label] |
resets a named counter |
.group(label) |
indents a group of log messages |
.groupEnd(label) |
ends the indented group |
.time(label) |
starts a timer to calculate the duration of an operation |
.timeLog([label] |
reports the elapsed time since the timer started |
.timeEnd(label) |
stops the timer and reports the total duration |
.trace() |
outputs a stack trace (a list of all calling functions) |
.clear() |
clear the console |
console.log() accepts a list of comma-separated values. For example:
let x = 123;
console.log('x:', x);
// x: 123
However, ES6 destructuring can offer similar output with less typing effort:
console.log({x});
// { x: 123 }
Larger objects can be output as a condensed string using this:
console.log( JSON.stringify(obj) );
util.inspect will format objects for easier reading, but console.dir() does the hard work for you.
The post How to Debug a Node.js Application: Tips, Tricks and Tools appeared first on SitePoint.